We can predict a stock’s future movement by applying a pivot point trading strategy.
What is pivot point trading?
Pivot point trading is a very popular trading method in the stock market. Traders all over the world utilize and accept it as an effective strategy. The accuracy and success rate of this strategy are quite high compared to other, more complicated methods.
Why is pivot point trading popular?
The main reason behind the popularity of the pivot point trading strategy is its simplicity and reliability. The chance of failure in adopting a pivot point trading strategy is quite low due to the fact that it’s a universal technical strategy. And the majority of traders around the world use pivot point trading strategy often as a reliable trading tool.
It is a flexible tool that offers unmatched accuracy throughout all time frames! A pivot point technique generates specific levels of support and resistance, providing you a significant advantage in spotting potential market turning points whether you’re a short-term scalper, medium-term swing trader, or long-term investor.
The pivot point technique is popular with traders all over the world because of its high level of accuracy, then why wait? Utilize a pivot point method right away to advance your trade!
Types of pivot points

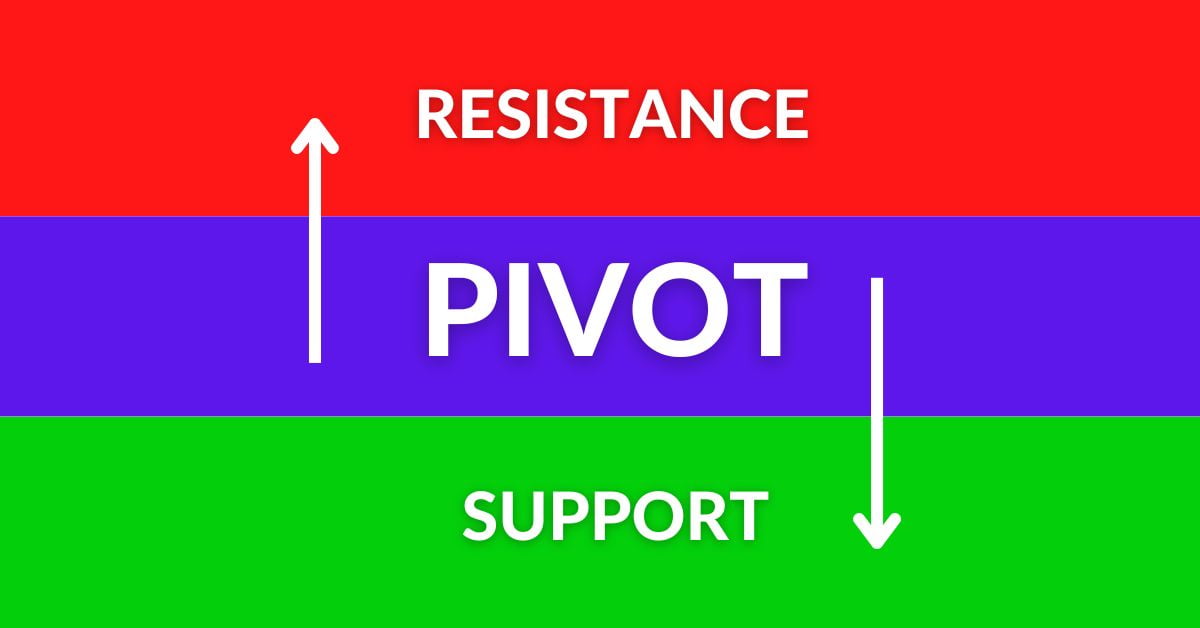
There are three types of pivot points: the actual pivot point, the support, and the resistance. The previous day’s stock’s closing and low and high prices are the parameters to calculate pivot points in day trading or swing trading.
It is a general rule that a stock tends to rise when its price trades above the actual pivot. On the other hand, if the stock’s current price falls below the actual pivot, it typically exhibits weakness or bearishness. It means when a stock is bullish, it always stays above the actual pivot point during the day. But when the price of the stock trades below the actual pivot point, then we can consider the stock a bearish one.
If we consider the opening price of a stock, the actual pivot points often play a vital role for rest of the day. Whenever stock opens above the actual pivot the majority of the time stock performs well during the day and vice-versa.
The intensity of the stock movement depends on the gap above or below the actual pivot point. The more we see the gap, the greater the chance of witnessing a sharp movement in the direction of the gap.
Key features of pivot point trading
What is support
Uncovering the support level is a powerful technique in the pivot point trading strategy. The term “support level” refers to a price point or range where demand for a stock is strong and selling pressure is minimal. This concept is particularly valuable when a stock’s price is in decline.
Technical analysts have developed a formula for determining support levels to gain a deeper insight into a stock’s buying zone. So, understanding support levels can give traders a significant edge in making profitable trades.
Pivot point trading typically involves three distinct levels of support: level 1, level 2, and level 3. These support levels act as barriers where a stock’s price temporarily stabilizes and tries to resist further selling pressure. In most market conditions, it is rare for a stock to break through the third support level.
This level serves as a strong barrier and is only breached in extreme cases such as panic selling or a significant negative event. So, understanding these levels of support can give traders a valuable edge in anticipating a stock’s price movements and making profitable trades.
What is resistance
Resistance levels are a crucial aspect of the pivot point trading strategy, just like support levels. These levels indicate the point at which a stock is likely to encounter selling pressure or profit-taking during an upward trend.
The technique for determining resistance levels is similar to that for determining support levels. This involves considering a stock’s high, low, and closing prices from the previous day. Understanding resistance levels can give traders valuable insight into a stock’s price movements. Because it helps them make profitable trades by identifying when to take profits or avoid buying at an overvalued price.
During typical market conditions, stocks will typically attempt to break through resistance levels one at a time. For a stock to break through the third resistance level, it typically requires strong bullish market sentiment.
How to calculate pivot, support, and resistance
The terms “support,” “pivot,” and “resistance” of stock were all familiar to us, but we had no idea how to calculate these values.
Pivots
PIVOT POINT = ( LOW + HIGH + CLOSE ) / 3
Supports
S1 = ( PIVOT x 2 ) – HIGH
S2 = PIVOT – ( HIGH – LOW )
S3 = LOW – { 2 x ( HIGH – PIVOT ) }
Resistance
R1 = ( PIVOT x 2 ) – LOW
R2 = PIVOT + ( HIGH – LOW )
R3 = HIGH + { 2 x ( PIVOT – LOW ) }
Frequently Asked Questions:
Is a pivot point strategy good for trading?
Pivot point trading utilizes historical market data to pinpoint key levels of support and resistance, giving traders the upper hand in identifying potential market turning points. Whether you’re looking to enter or exit a trade, a pivot point strategy provides valuable insights to inform your decisions and maximize your trading success. But remember, no strategy is infallible, so be sure to complement your pivot point analysis with other technical and fundamental tools to fully capitalize on the markets.
Which time frame is best for pivot point trading?
Whether you’re a scalper, swing trader, or long-term investor, the pivot point strategy gives you an advantage in identifying potential market turning points by creating specific levels of support and resistance. Therefore, the pivot point trading method is applicable to all time frames.
Which pivot point method is best for traders?
Although there are a variety of pivot point strategies that may be utilized in trading, the standard method that is most frequently employed is the one we covered above. The market frequently respects the levels provided by the standard technique because they are straightforward and precise.
Conclusion
Please keep in mind that pivot point levels are applicable to normal market conditions only. Because, in highly volatile and highly bullish or bearish market situations, the stocks or indices hardly ever adhere to certain levels. So, to be a successful trader in the stock market, one must have not only the right trading strategy but also discipline.