Nifty and Bank Nifty Prediction for tomorrow, April 21, 2023: Today, the Indian equity market broke its three-day losing streak, with the Nifty 50 and Nifty Bank closing positively. However, the pharma, real estate, metal, and FMCG sectors experienced sell-offs, limiting Nifty’s upward movement.
On the other hand, the industrial, banking, and auto indices closed positively. Both the Nifty and Banknifty managed to maintain their respective closing levels of 17600 and 42200. The Nifty Pharma index was the biggest sectoral loser, dropping by 1.11%. The Nifty Midcap and Nifty Smallcap indices closed flat with minor gains. The weekly F&O expiry ended uneventfully with no significant gains for option buyers.
Nifty and Banknifty Movement of the Day
| Index Value | Change | Percentage Change | Open | High | Low |
| 17,624.45 | 5.70 | 0.03% | 17,638.60 | 17,684.45 | 17,584.35 |
| 42,269.50 | 115.50 | 0.27% | 42,218.50 | 42,378.15 | 42,108.85 |
The Nifty and Bank Nifty indices closed at 17,624.45 and 42,269.50, respectively, today. The Nifty moved only 5.70 points, or 0.03%, while the Banknifty also finished in the green, up 115.50 points, or 0.27%.
After the opening highs, Nifty and Banknifty fluctuated inside a relatively small range the rest of the day. However, both indexes could not establish a distinct trend because of the current weekly F&O expiry positions. Nifty 50 and Nifty Bank both had intraday lows of 17,584.35 and 42,108.85, respectively, but could still close above the key support levels.
Top Nifty 50 Gainers of the Day
| Company Name | Stock Price | Change | % Change |
| Tata Motors Ltd | 476.8 | 7.40 | 1.58% |
| NTPC Ltd | 169.7 | 2.60 | 1.56% |
| Asian Paints Ltd | 2,843.85 | 34.15 | 1.22% |
| Adani Ports & Special Economic Zone Ltd | 666.1 | 7.70 | 1.17% |
| Bajaj Auto Ltd | 4,314.35 | 48.55 | 1.14% |
| HDFC Life Insurance Company Ltd | 530.25 | 5.45 | 1.04% |
| Bharti Airtel Ltd | 772.3 | 7.65 | 1% |
| State Bank of India | 544.8 | 4.50 | 0.83% |
| Tech Mahindra Ltd | 1,021.8 | 7.90 | 0.78% |
| Apollo Hospitals Enterprise Ltd | 4,348.4 | 28.10 | 0.65% |
Top Nifty Bank Gainers of the Day
| Company Name | Stock Price | Change | % Change |
| Bandhan Bank Ltd | 217.85 | 3.50 | 1.63% |
| State Bank of India | 544.80 | 4.50 | 0.83% |
| IndusInd Bank Ltd | 1,126.20 | 5.80 | 0.52% |
| Federal Bank Ltd | 132.30 | 0.60 | 0.46% |
| HDFC Bank Ltd | 1,671.90 | 6.20 | 0.37% |
| Bank of Baroda | 177.75 | 0.50 | 0.28% |
| ICICI Bank Ltd | 894.40 | 2.50 | 0.28% |
| AU Small Finance Bank Ltd | 679.40 | 0.80 | 0.12% |
| Punjab National Bank | 48.60 | 0.05 | 0.10% |
| IDFC First Bank Ltd | 56.40 | 0.05 | 0.09% |
Nifty prediction for tomorrow 21st April 2023
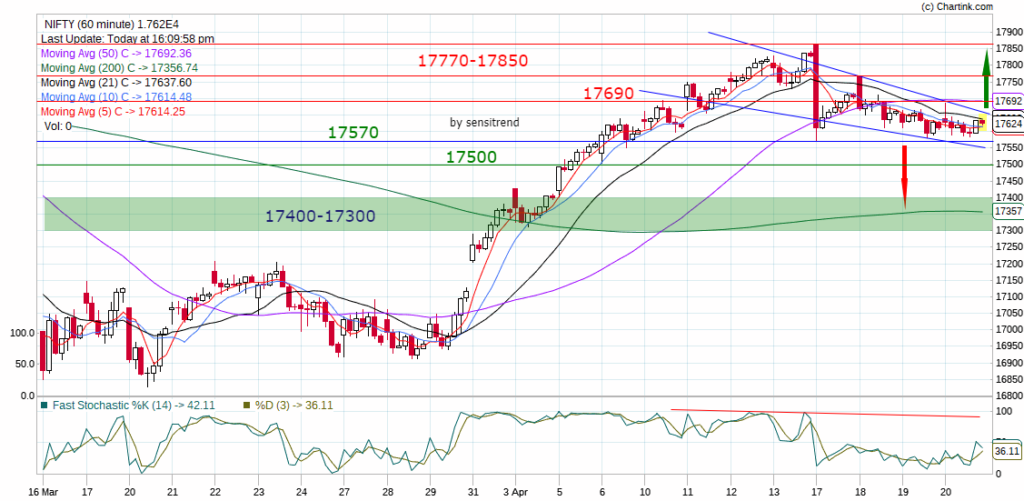
On the hourly chart of the Nifty, a falling wedge pattern is developing in the area between 17570 and 17770. Any breakout on either side will govern a definite trend for tomorrow.
On the upside, if the Nifty trades above 17700, we can predict a new trend for additional gains up to 17800 and beyond. On the other hand, it must break and hold below 17570 on an hourly basis in order to trade in new negative territory.
Below 17570, which served as multiple support during the past few sessions, a new downward drop towards 17500-17400-17300 will take place.
Nifty 50 Upside and Downside Levels for Tomorrow
| Nifty Upside Levels | ||
| 17680 | 17730 | 17780 |
| Nifty Downside Levels | ||
| 17580 | 17530 | 17480 |
Bank Nifty prediction for tomorrow 21st April 2023
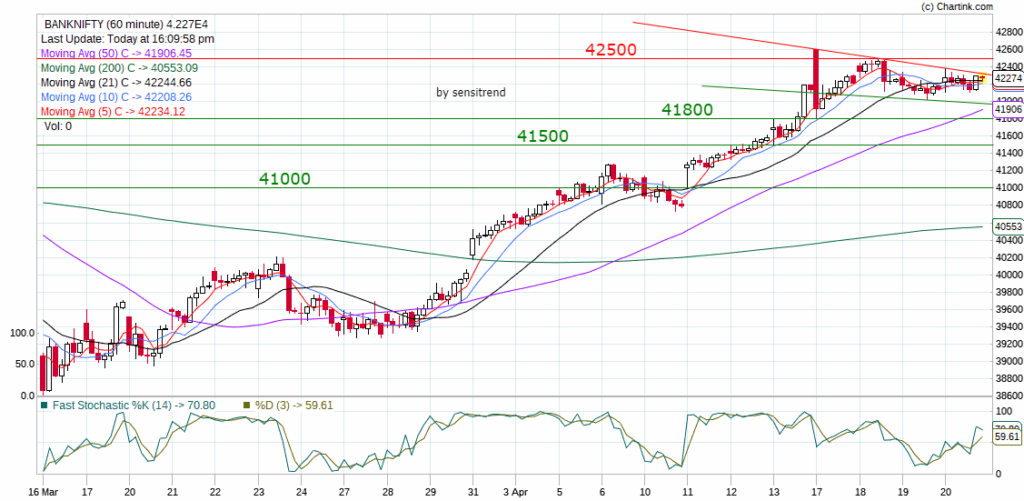
The showed Bank Nifty’s 1-hour chart shows a constant range between 42000 and 42300. Banknifty has been unable to make a clear break on either side of the range for the past few sessions.
Therefore, on an hourly basis, Bank Nifty must break either 42000 to the downside or 42300 to the upside in order to establish a clear trend.
On the upside, there will be resistance near 42500. However, once 42500 is broken, we should expect a fierce move toward 42750-42800.
When Banknifty breaks 42000, the range of supports on the downside will be 41800-41500. The next significant support level will be 41000 below 41500. But 41500 will also operate as a strong demand zone.
It should be observed that when analyzing the hourly charts, Banknifty’s chart structure appears to be much stronger than Nifty’s.
Nifty Bank Upside and Downside Levels for Tomorrow
| Banknifty Upside Levels | ||
| 42380 | 42500 | 42620 |
| Banknifty Downside Levels | ||
| 42140 | 42000 | 41900 |
Nifty and Bank Nifty Weekly Options Chain Analysis
Based on the options data analyzed for the April month F&O expiry, it appears that NIFTY and BankNifty are looking positive. NIFTY has heavy writing of both call and put option contracts. The highest open interest is observed at the 18500 call option and 17700 put option.
BankNifty, on the other hand, has the highest open interest at the 42000 PE option and 43000 CE, along with considerable put writing seen in all ATM and OTM option contracts and significant call buying activities. This indicates that BankNifty may exhibit more strength to move up compared to NIFTY.
Global Markets Update
Asian markets such as Shanghai, Kospi, and Taiwan experienced declines of 0.09%, 0.47%, and 0.40%, respectively. However, Nikkei and Hang Seng ended the day with minor gains of 0.18% and 0.14%, respectively.
Meanwhile, in Europe, DAX and CAC were down by 0.60% and 0.05%, respectively, while FTSE was trading flat with only a slight increase of 0.05%.
On Thursday, U.S. stocks saw a decline following disappointing earnings reports from Tesla and AT&T. The S&P 500, NASDAQ Composite, and Dow Jones Industrial Average are down by 0.47%, 0.32%, and 0.24%, respectively. U.S. 10-year treasury yields have fallen by 2%.
Additionally, base metals and crude oil prices have dropped by between 1.5% and 2.5% due to concerns about an economic slowdown.
Conclusion
Nifty and Bank Nifty are trading within a range on the hourly charts. A breakout on either side will determine tomorrow’s trend. It is worth noting that when analyzing the hourly charts, Bank Nifty appears to have a stronger chart structure than Nifty. Option chain data shows positive signs, with heavy put writing in Bank Nifty and a balance between call and put writing in Nifty. The shift in levels upward also indicates the potential for both indices to move up.
Stay tuned for tomorrow’s weekly closing, and happy trading!
Please note that all levels discussed above, including those for Nifty and Banknifty, are spot prices.
Chart Credit: Chartink
Disclaimer: To learn additional information about the disclaimer, please refer to the “Disclaimer Page.”
