
Nifty 50 Prediction for Next Week, March 27-31, 2023: Nifty ended the volatile week below 17000 after a long time. The key psychological level of 17,500 was very important in terms of the underlying strength of the Nifty 50. The fall in the Nifty 50 was largely due to an amendment to the Finance Bill 2023, which had a negative impact on the market. Also, weakness in global banking stocks added fuel to the sharp decline in both the Nifty and the Banknifty.
The fall of Deutsche Bank’s share price on Friday pushed all global banking stocks to jitter. Most probably, the European banks were the major contributors to the overall weakness in global markets. On Friday, the Dow Jones, S&P 500, and Nasdaq 100 also showed weakness during the first half. But finally, the closing of the U.S. market was very impressive, keeping aside all worries about the banking crisis.
Despite the volatility in the global markets, the SGX Nifty closed on a positive note, gaining 118.00 points or 0.7 percent. It was likely due to the strong performance of the DJA, S&P, and Nasdaq by closing on Friday.
Chart Credit: Chartink/Nifty 50 price movement this week 20-24 March 2023
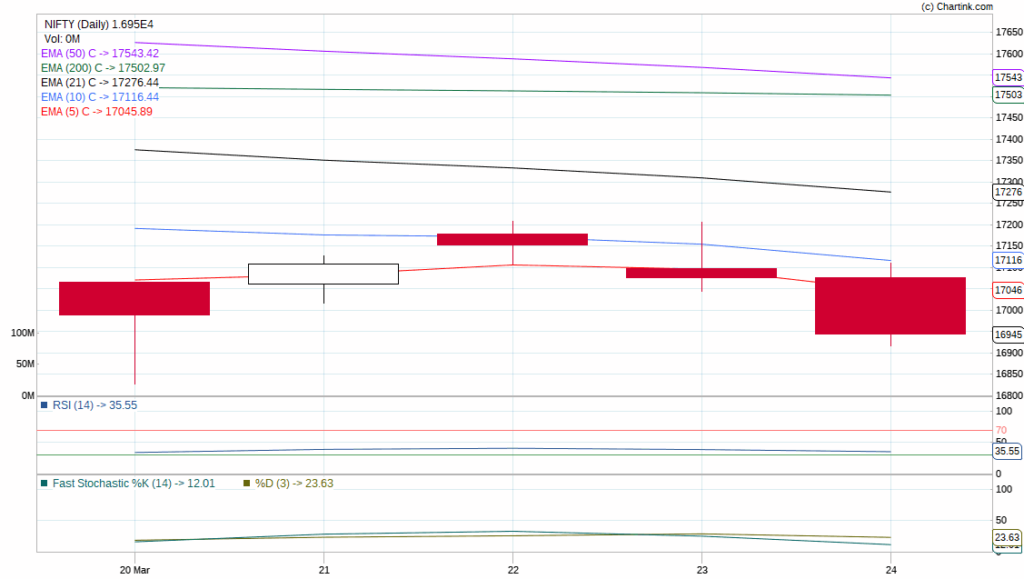
Nifty 50 Price Movement this week, 20-24 March 2023
Last week, the Nifty 50 saw a decline of 155 points, or 0.9 percent, compared to the previous week. The week began with a negative daily candle formation on Monday, but the next day it had a gap-up opening and closed above 17,000. However, for the remainder of the week, it struggled to sustain its opening price. On Wednesday, Thursday, and Friday, the Nifty 50 made three consecutive lower highs and lower lows, ultimately ending the week with significant volatility and closing at its lowest point. The high and low for the Nifty 50 this week were 17207.25 and 16828.25, respectively.
Nifty 50 Prediction for Next Week 27-31 March 2023
EMAs, Pivot, Support & Resistance Levels of Nifty
| EMA | Nifty 50 Price |
| 5-DAY EMA | 17272.14 |
| 10-DAY EMA | 17492.68 |
| 21-DAY EMA | 17629.74 |
| 50-DAY EMA | 17421.96 |
| 200-DAY EMA | 15038.84 |
NIFTY 50 EMAs on the daily chart
The weekly chart of the Nifty 50 shows that it is trading below the short-term EMAs. This could suggest a bearish trend for the Nifty 50 next week.
Nifty 50 Pivot Levels for Next Week
| Pivot Levels | Nifty 50 Price |
| Pivot | 16993.55 |
| Resistance 1 | 17158.75 |
| Resistance 2 | 17372.45 |
| Resistance 3 | 17537.65 |
| Support 1 | 16779.85 |
| Support 2 | 16614.65 |
| Support 3 | 16400.95 |
Nifty 50 pivot levels for next week
The Nifty 50 index closed at 16945.05 on a weekly basis. Pivot levels, which are used in technical analysis to determine potential price points, suggest a weaker setup for the Nifty next week unless it is able to maintain a level above 16993.55. The immediate resistance and support levels for the Nifty 50 are predicted to be at 17158.75 and 16779.85, respectively.
PCR Value and Nifty Open Interest
Derivative data for the Nifty: Based on the current put/call ratio (PCR) value of 0.69 for the Nifty, the sentiment is considered neutral. Looking at the Nifty OI data, the highest number of open positions have been observed at the 18,000 calls and 17,000 put strike prices for the March 29th monthly expiry. On Friday, there were new additions to both puts and calls. But probably, call writing and put buying were seen throughout the day with fresh open interest (OI) additions. Hence, this suggests that traders in the futures and options (F&O) market are betting on a potential breakdown below the current Nifty level.
Multiple Timeframe Analysis for Nifty 50
4-hour chart analysis of Nifty 50

Nifty 50 4-hour chart analysis
Weekly chart analysis of Nifty 50

Chart credit: Chartink/Nifty 50 weekly chart analysis
Nifty outlook for next week: Based on charts that analyze the Nifty 50 across multiple time frames, it appears that the index has been experiencing a downtrend within a channel for the past 2 months. The upper limit of this channel appears to be between 17250 and 17450, which has been acting as a significant resistance level. On the other hand, the lower limit of the channel between 17950 and 17750 has been serving as strong support.
After analyzing the 4-hour and weekly charts of the Nifty 50, it appears that the index is likely to receive very strong support between 16800 and 16,750. This level has acted as a barrier to declines in the past. If it is breached, it could result in a fast downtrend in the Nifty. If the index falls below 16,750, it is possible that it could drive down to a level below 16,400 in the coming week.
The Nifty 50 appears to be in a weak trend across all time frames. Therefore, it increases the likelihood of a channel breakdown next week. One sign of this ongoing downtrend is the weekly closing of the Nifty 50 below 17,000 on March 24, 2023. Based on chart analysis, 16,750 and 17,250 will be significant levels on the downside and upside, respectively, on a closing basis. There is a strong supply area on the upside, up to 17,450.
Buying the Dips and Selling the Rise strategy
The Nifty has been stuck within a narrow range for several weeks. The upside range is 17250, and the downside range is 16,800. So, unless and until the Nifty breaks on either side, one can play the “buy the dips and sell the rallies” strategy. Traders should be ready to use this counter-trend strategy until the Nifty breaks out of this current trading range.
Global Cues for Next Week
The upcoming week will be crucial for the stock market. The release of the latest U.S. core PCE price index will have a significant impact. So, it could determine the Federal Reserve’s future policy decisions. Additionally, the focus will be on the developments related to the bank crisis, particularly the health of U.S. regional banks. There are concerns about their stability, making it an important issue to keep an eye on.
The ongoing situation with Deutsche Bank is being closely monitored by global markets. Its stock prices took a sharp downturn last week. This had a ripple effect on banking stocks across the world, especially in Europe. The situation with Deutsche Bank has garnered attention due to its importance as one of the largest banks in Europe and its potential impact on the wider financial system.
The ongoing geopolitical tensions between Russia and Ukraine could have an impact on the upcoming week, as they may directly affect commodity prices. The situation could also have a direct impact on the prices of the US dollar index and bond yields. Traders and investors need to keep an eye on these developments as well.
Conclusion
Nifty’s weekly chart suggests it will remain bearish in the coming week. Furthermore, there is the March Futures and Options (F&O) expiry next week, which means that trading sessions could see extreme volatility. Traders should refrain from taking any new risks in the market before the monthly F&O settlement. If the Nifty bounces back, it could be a good opportunity to sell until it breaks higher, as previously discussed.
Disclaimer:
Before making trading decisions, we urge you to read and understand our Disclaimer page.