Introduction
Most investors and traders rush to chase an all-time high market for a quick gain, seeing souring indices and stocks. The fear of missing out (FOMO) often drives these people to this highly valued market. They hope to capitalize on the strong momentum of the market.
However, this rush can lead to getting trapped at higher levels. Big investors often exploit this scenario by selling their holdings at peaks. As a result, new buyers generally suffer significant losses.
Consequently, they turn into long-term investors as they wait for prices to recover.
What is the solution?
It’s essential to be well-informed and strategic to avoid falling into the trap of markets at record highs. Monitoring specific indicators can help traders and investors make smarter decisions. This will prevent them from experiencing the complexities of the euphoric market.
Read also: How to Make a Winning Trading Plan
I have outlined a few key indicators below to chase a market at record highs.
10 Key Indicators to Monitor All-Time High Market
Volume Analysis

Volume is a significant indicator for traders and investors. When the market moves higher with volume, the trend will remain intact. However, the market may pause its uptrend when the volume is missing with the higher price actions.
So, to know about the existing strength and trend, volume is a good indicator when you chase the market at all-time highs.
Relative Strength Index (RSI)

The Relative Strength Index (RSI) measures the speed and change of price movements. When RSI and the price move simultaneously, the trend may continue. In a strong trending market, if the value of RSI remains above 60–70, the strength and momentum will persist for a longer period.
Also read: Trading Psychology: How to Achieve Best Winning Mindsets
Bullish MACD Crossover

The MACD is a momentum indicator that shows the trend of the market. It consists of two moving averages. When the MACD line crosses above the signal line, bullish upward momentum will continue.
Until and unless the MACD line changes the trend, the market will gain further during record highs.
So, to deal with the confusion when you chase a trending market, you must also check MACD.
Moving Averages (MA)

Moving averages can always give you an idea when you want a confirmed bullish view. The market should always trade above moving averages for a bullish trend to remain intact.
However, there are a few significant moving averages that are 50-day, 100-day, or 200-day MAs.
The bullish trend will remain strong and sustained when the market trades above those MAs.
Also read: 10 Golden Rules of Stock Market Trading
Bollinger Band Analysis
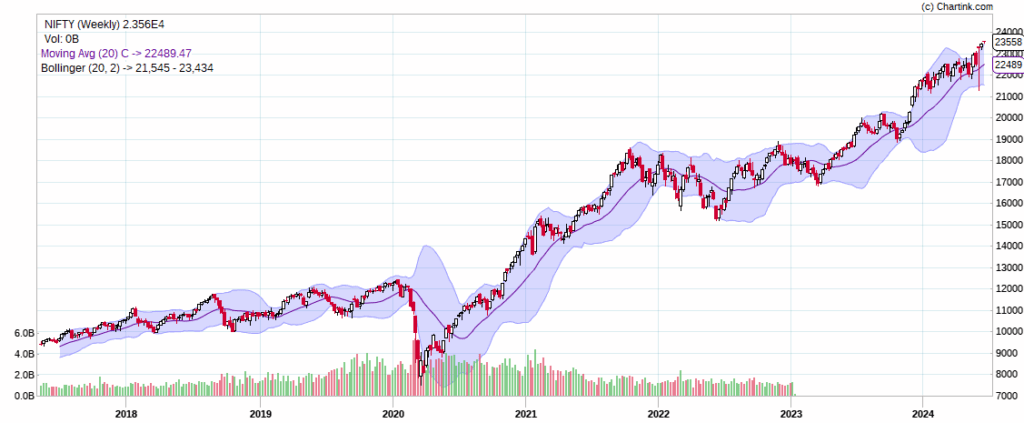
Bollinger bands are good indicators for gauging volatility in the market. It can also give an idea about the intensity of the price momentum. The higher price inclination in the upper band means the intensity and rise of the market will remain strong, and vice versa.
ADX (average directional index)
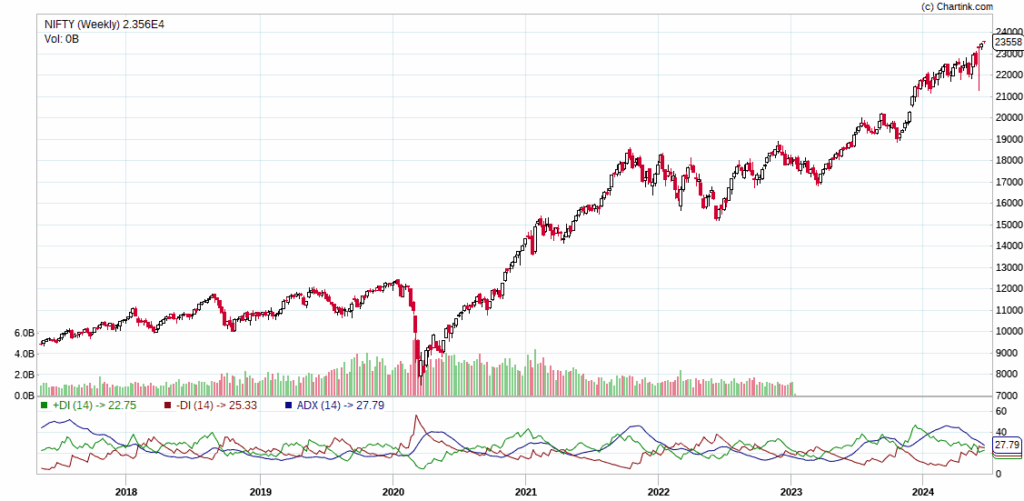
The ADX is also a tool to measure the strength and underlying strength of the market. A value of ADX above 20 means the trend is strong and positive. There are two lines, +DI and -DI, and the crossing of +DI over -DI with the value of ADX above 20-25 signifies strong momentum with a positive trend that will become visible.
If you see the fulfillment of those conditions when a market is at its strongest trend, there will be a strong probability of a continuation pattern.
Upward Trend Lines

An upward trend line is a straightforward but powerful indicator in the stock market. It’s the best indicator to identify the existing trends in the market. One can also predict future movement when the market trades at record highs.
Also read: What is Blue Sky Zone in the Share Market
An upward trend line means a line consists of successive higher lows. The trend will remain strong and continuous in the future when the price continues to trade above the connecting line.
Momentum Indicators (Stochastic Oscillator)
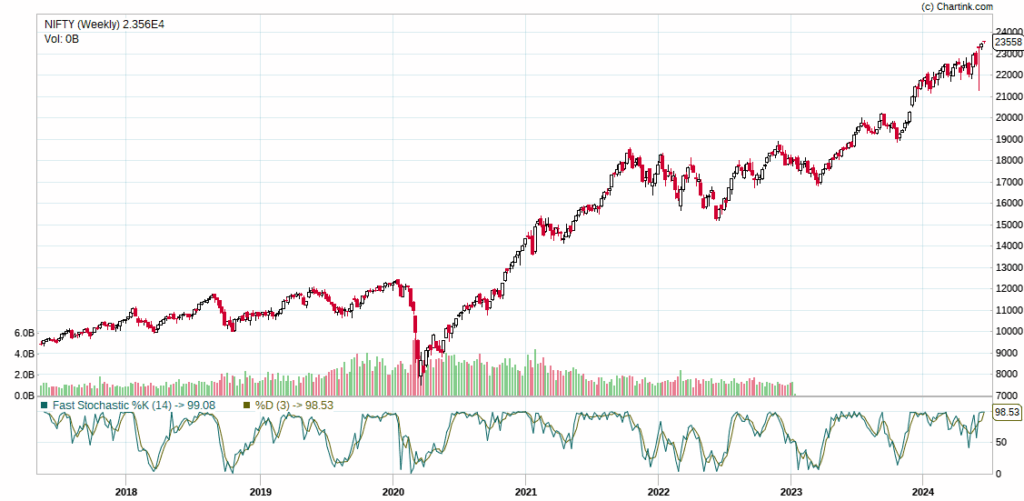
Momentum is one of the most essential parameters of a trend. A positive cross-over of the oscillator line above the signal line always signifies strong momentum. The trend will continue until the fast stochastic line stays above the signal line.
Bullish Price Patterns

Chart patterns like double top, triple top, flags, pennants, and ascending triangles often indicate continuation. When these patterns form and break out in the direction of the prevailing trend, the upward movement will continue.
Advance and Decline Ratio

To know the strength of the broader market, the advance and decline ratio is your best friend when you go to the buying side. The market’s breadth will always be strong when stocks in advance are higher than stocks in decline. The strength of broader market activity will help create multiple fresh highs in the benchmarks.
VIX (Volatility Index)

The VIX calculates market volatility. More volatility means more uncertainty among investors in the market. So the market is prone to falling or profit booking while making record highs. The disruption will pause the trending market.
However, a crash in VIX will also help to continue the existing uptrend in the market.
Also read: Price Action Trading: Unlock the full potential of Profits
Conclusion
If we carefully observe those indicators, we can execute safer trades most of the time. However, most indicators should not show divergence when indices hit all-time highs. For profitable long trades, indicators and price actions must move together in the same direction.
Therefore, traders and investors can avoid the all-time high market trap by following the discussed indicators.
Disclaimer: The above content is only based on my beliefs, experiences, thought processes, and intuition about the stock market. So, the market may not follow these assumptions 100% of the time.